Metering history
Introduction
Section titled “Introduction”Metering history consists of two graph views, a detailed graph displays the use of the application per minute and a peak graph displaying the max use of the application per day. Both graphs contain a graph showing the number of licenses per minute or day.
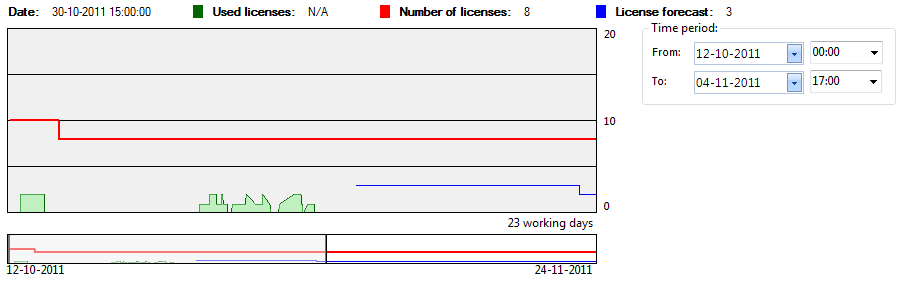
| Graph | Description |
| Used licenses | Displaying the number of units using the one the applications in the application group pr. minute. |
| Number of licenses | The number of licenses registered for the application group pr. day |
| License forecast | The expected number of user applications in the future pr. day. If a lot of users have not used the software in a long time, there is a prediction that it is possible to uninstall the software on their computer |
| Step | Action |
| 1 | To zoom on the graph view, select a time period, use the mouse scroll wheel or make a selection on the lower graph with the right mouse button |
| 2 | Zoom out by changing the time period or use the mouse scroll wheel |
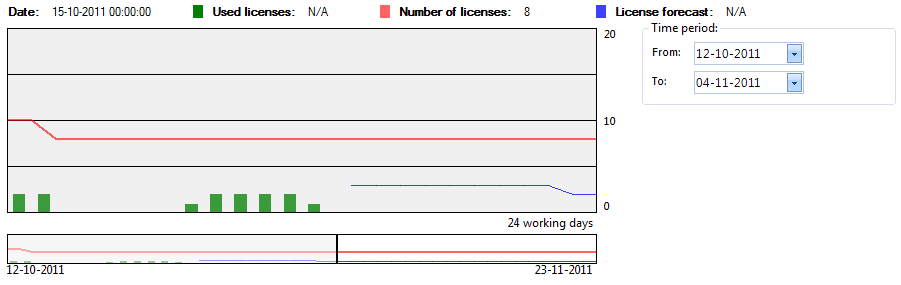
| Graph | Description |
| Used licenses | Displaying the number of units using the one the applications in the application group pr. day. |
| Number of licenses | The number of licenses registered for the application group pr. day |
| License forecast | The expected number of user applications in the future pr. day. If a lot of users have not used the software in a long time, there is a prediction that it is possible to uninstall the software on their computer |
| Step | Action |
| 1 | To zoom on the graph view, select a time period, use the mouse scroll wheel or make a selection on the lower graph with the right mouse button |
| 2 | Zoom out by changing the time period or use the mouse scroll wheel |