

Build a Dashboard with Claude
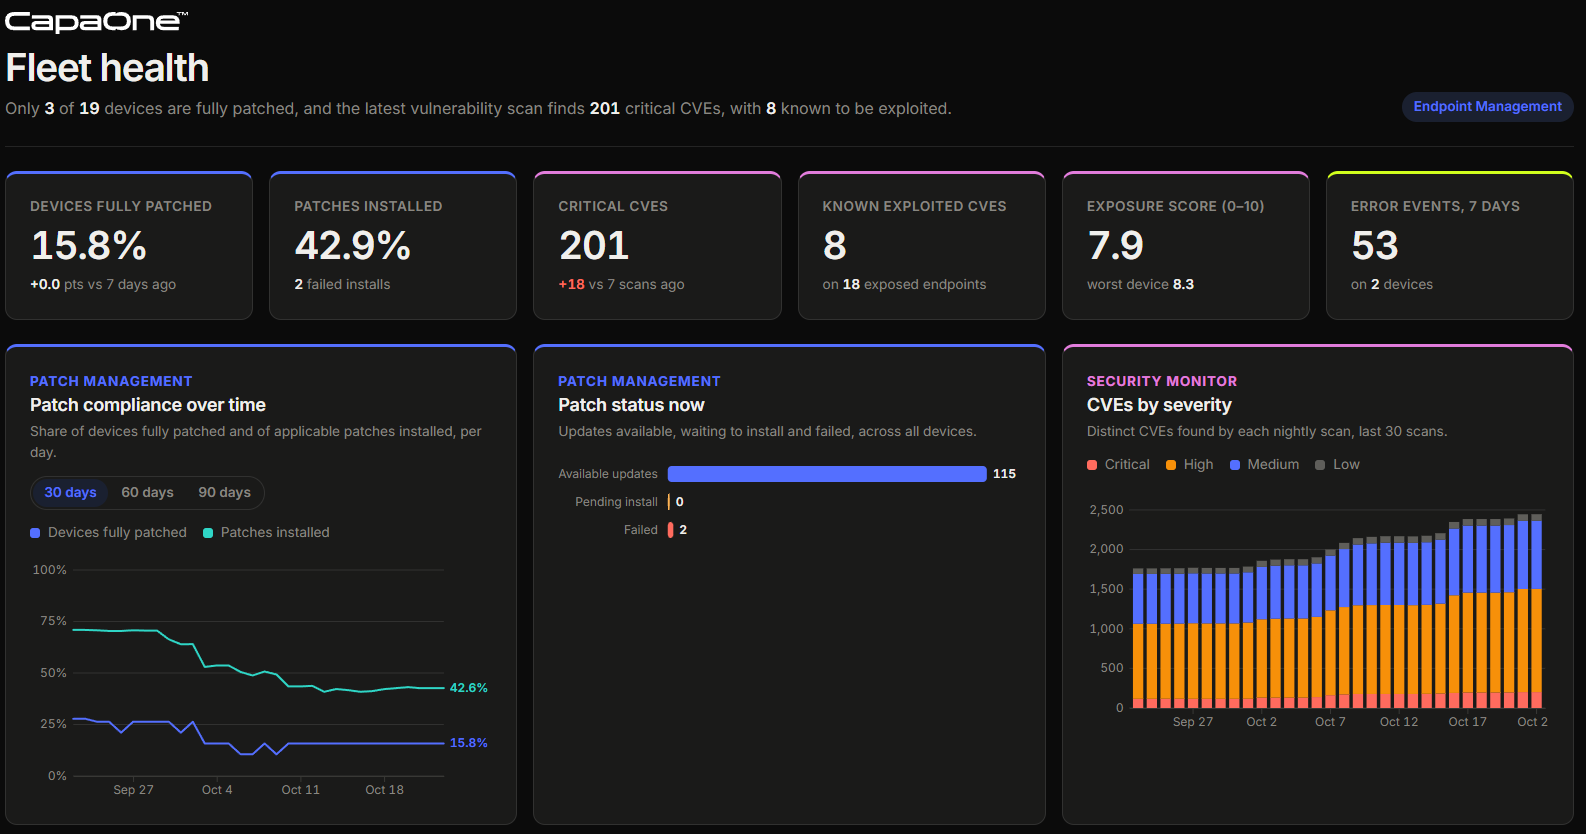
Claude can fetch your fleet data through the CapaOne MCP server and build a dashboard from it.
Ask for a dashboard
Section titled “Ask for a dashboard”In a new chat, describe the dashboard you want:
Use the CapaOne tools to build a dashboard of our patch compliance for thelast 90 days and our CVEs from the last 30 vulnerability scans.Claude on the web and in the desktop app shows the dashboard as an artifact next to the chat. Claude Code writes it to an HTML file.
Refine it
Section titled “Refine it”Keep the chat going to change the dashboard, for example:
- Add the ten devices with the most failed patches.
- List the known exploited CVEs.
MCP Tools shows what else Claude can fetch.
Refresh it
Section titled “Refresh it”The dashboard shows the data from when Claude built it. To update it, ask Claude to refresh it with today’s data.
Fix it after a tool change
Section titled “Fix it after a tool change”The CapaOne MCP tools change as the MCP server grows. A tool can be renamed, merged into another tool, or removed. A refresh that relies on a tool that has changed can then fail.
Ask Claude to fix it:
The dashboard no longer refreshes. Rebuild it with the current CapaOne tools.Claude finds the tools that replaced the old ones and updates the dashboard. If Claude keeps asking for a tool that no longer exists, start a new chat and ask for the dashboard again. A new chat loads the current tools.
MCP Tools lists the tools there are today.