Dashboard
The Dashboard provides a centralized overview of endpoint security posture across the environment. It highlights key protection and configuration indicators such as antivirus status, encryption, firewall configuration, and update compliance, helping administrators quickly identify risks and prioritize remediation.
Security indicators
Section titled “Security indicators”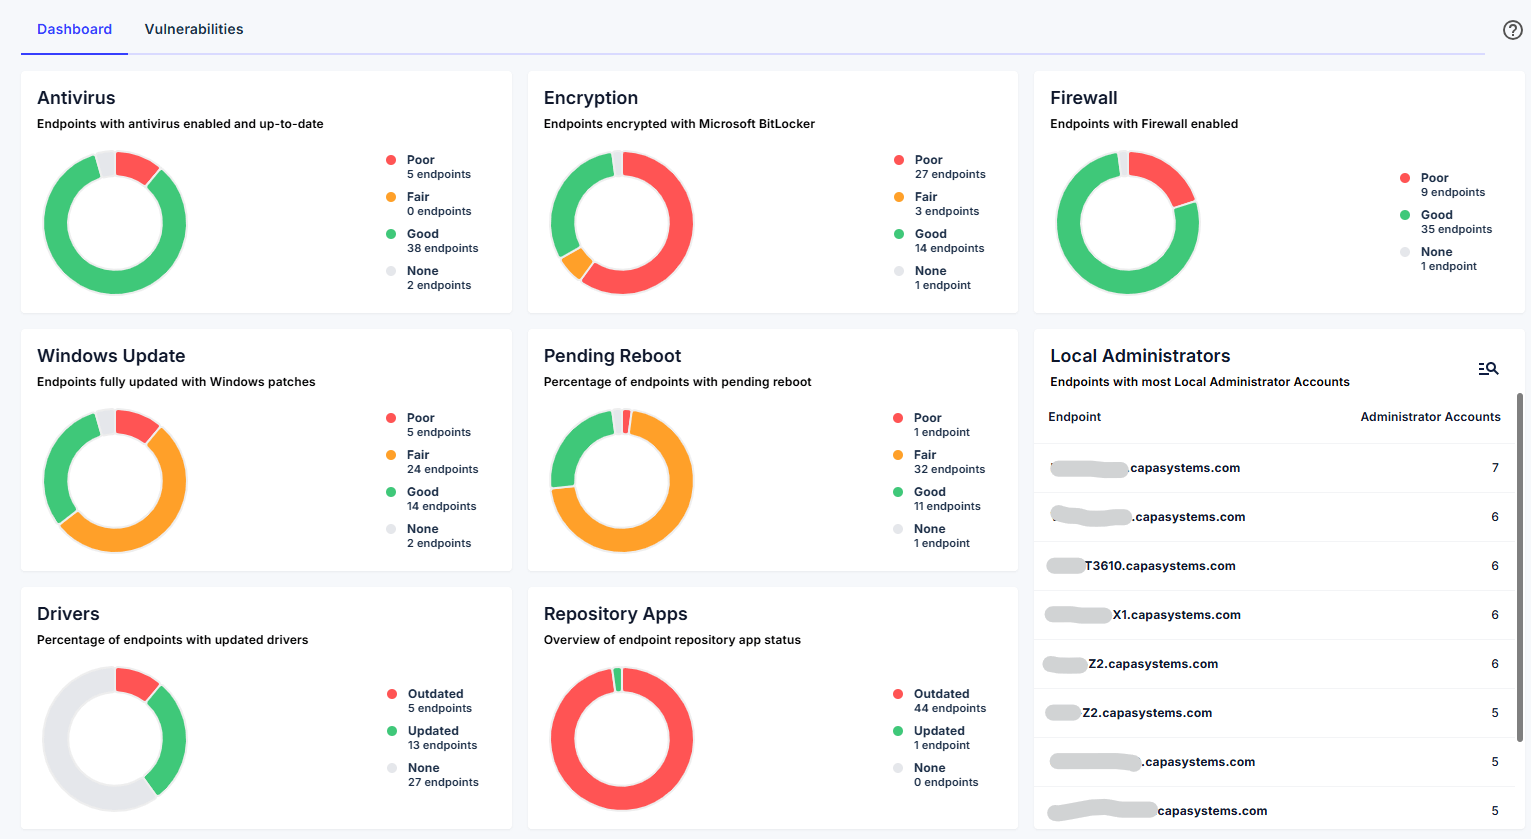
The dashboard presents multiple security indicators that reflect the overall security configuration of managed endpoints. Most indicators use a traffic-light classification model:
- Poor
- Fair
- Good
- None (no data returned during inventory collection)
Selecting a segment within a chart displays the list of endpoints associated with that status, allowing administrators to quickly investigate affected devices.
Antivirus
Section titled “Antivirus”The Antivirus chart displays endpoint protection status using the traffic-light model.
As antivirus software represents a primary defense layer for endpoints, maintaining correct configuration and up-to-date definitions is essential for protecting devices against malware and other threats.
None indicates that antivirus status data was not returned during inventory collection.
Encryption
Section titled “Encryption”The Encryption chart provides visibility into disk encryption status across endpoints.
Endpoints are categorized as Poor, Fair, Good, or None, depending on encryption configuration and reporting availability.
Proper encryption helps protect organizational data in the event of device loss or unauthorized access.
Firewall
Section titled “Firewall”The Firewall chart indicates whether endpoint firewalls are properly enabled.
Endpoints are categorized as:
- Good – Firewall enabled
- Poor – Firewall disabled or misconfigured
- None – No data available
An active firewall is a fundamental safeguard against unauthorized network access.
Windows Update
Section titled “Windows Update”The Windows Update chart reflects operating system patch compliance across endpoints.
Endpoints are categorized as Poor, Fair, Good, or None, based on update status and pending security patches.
Maintaining current updates reduces exposure to known vulnerabilities and security risks.
Pending Reboot
Section titled “Pending Reboot”The Pending Reboot chart identifies endpoints requiring a restart to finalize updates or configuration changes.
Endpoints are categorized as Poor, Fair, Good, or None, depending on reboot urgency and reporting status.
Ensuring restart compliance helps guarantee that updates and security patches are fully applied.
Drivers
Section titled “Drivers”The Drivers chart highlights endpoints with outdated or unsupported drivers.
Endpoints are categorized as:
- Updated
- Outdated
- None – unsupported drivers or unavailable data
Keeping drivers updated improves system stability, compatibility, and overall security posture.
Repository Apps
Section titled “Repository Apps”The Repository Apps chart provides insight into application patch compliance for software supported by CapaOne Repository Apps.
Endpoints are categorized as:
- Updated – Running the latest repository version (or a newer equivalent version)
- Outdated – Not running the latest available repository version
- None – No data returned during inventory collection
This view helps administrators quickly identify applications requiring updates across the environment.
Local Administrators
Section titled “Local Administrators”The Local Administrators section identifies endpoints with excessive local administrator accounts.
Organizations typically define an approved number of administrator accounts per device. Endpoints exceeding this threshold may indicate configuration drift or increased security risk.
Selecting a device redirects to its detailed view, where assigned administrator accounts can be reviewed and corrective action planned.