Network
Monitor real-time network performance across all endpoints in a unified view, covering both wired and Wi-Fi connections. Identify latency, stability issues, and performance fluctuations to maintain consistent connectivity and overall network health.
Live Network Performance
Section titled “Live Network Performance”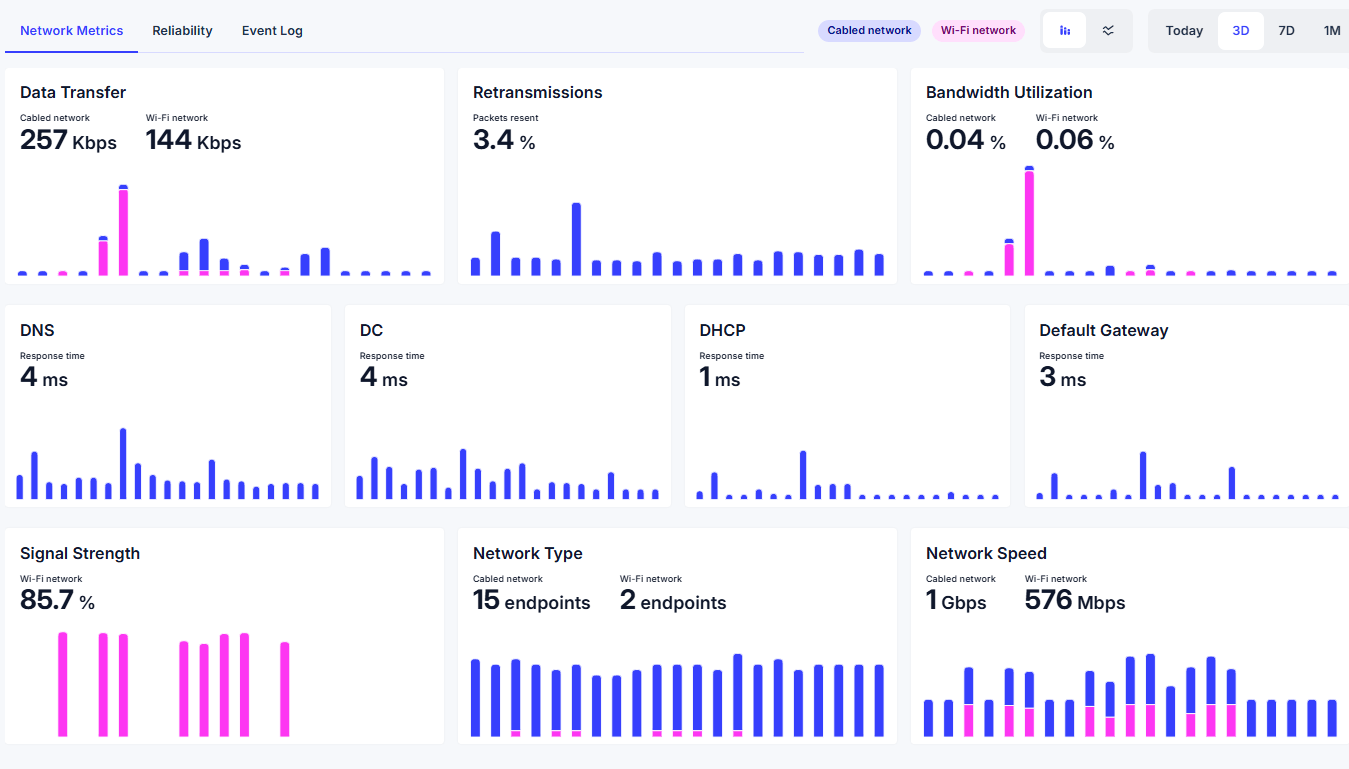
Live Network Performance provides real-time visibility into network metrics across all devices in your environment.
Interactive charts help administrators detect stability issues, performance spikes, or drops while providing a clear view of endpoint connectivity across the organization.
View Mode
Section titled “View Mode”
Use the View Mode switch in the top-right corner to toggle between different chart visualizations. Available options include:
- Column Chart – Useful for comparing performance values within specific time intervals
- Line Chart – Ideal for analyzing trends and fluctuations in network performance over time
Switching between visualization modes allows administrators to analyze connectivity data from different perspectives.
Time period
Section titled “Time period”
Use the time selector in the top-right corner to define the reporting range for network performance data. Available options include:
- Today
- Last Three Days
- Last Seven Days
- Last Month
Adjusting the time range allows administrators to analyze both short-term performance fluctuations and longer-term connectivity trends.