# Performance Counters
> See current and historical performance counters, such as CPU usage, for your organization's computers.
Source: https://docs.capaone.com/performanceguard/technical-reference/concepts/performance-counters/
Product: PerformanceGuard — a separate CapaSystems product; do not apply this page to any other.
The **Performance Counters** graph (**ANALYZE > Computers > Performance Counters**) lets you view details about the current and historical performance of your organization's computers:
- Standard performance counters, such as CPU usage, startup times and much more
- Details about processes running on the selected computer, by process name as well as by process ID
:::caution
IP data process information is not collected on computers that run Windows XP.
:::
- [Custom Counters](/performanceguard/administration/custom-counters/), that is data collected by the custom counters that you have yourself set up in PerformanceGuard
The graph is highly dynamic and [Interactive Graphs](/performanceguard/technical-reference/concepts/interactive-graphs/): You can add data from multiple computers, you can mix different types of data (from the **Standard Counters**, **Processes** and **Custom Counters** tabs) on the same graph, you can zoom in on areas of interest, etc. You can view up to five counters on the graph at a time.
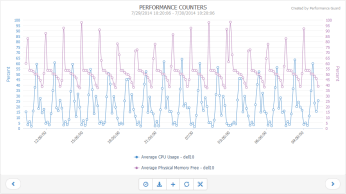
# **Standard Counters**
1. Start typing to search through all available computer names.

:::tip
If you prefer it, you can also search for agent IDs. Agent IDs are displayed to the right of computer names in search results.
:::
2. When you have selected a computer, select the counter (for example **cpu-usage**) that you want to view on the graph.
3. Click the **ADD TO CHART** button. It may occasionally take a few seconds before the selected counter appears on the graph.
:::tip
If some of your counters overlap and are difficult to view, you can toggle the display of each counter off and on if you click the name of the counter in the legend area below the chart. Learn more about this, how to zoom, how to add this type of chart to reports, etc. i **[Interactive Graphs](/performanceguard/technical-reference/concepts/interactive-graphs/).**
:::
# **Processes**
1. Start typing to search through all available computer names.

:::tip
If you prefer it, you can also search for agent IDs. Agent IDs are displayed to the right of computer names in search results.
:::
2. When you have selected a computer, select the process (for example **System**) that you want to know more about.
You can toggle between looking for processes by process name or by a specific process ID if you click the **By process name** or **By process id** buttons.

:::note[Important]
What's a process ID?
It's a number used by the operating system to identify individual processes. This is relevant because some processes may have several instances running at the same time. For example, there are often several instances of processes used for internet browsing and of *svchost*, which is a system process designed for hosting multiple Windows services).
:::
3. Select the required counter (for example **cpuAvg**) that you want to view on the graph.
4. Click the **ADD TO CHART** button. It may occasionally take a few seconds before the selected counter appears on the graph.
:::tip
If some of your counters overlap and are difficult to view, you can toggle the display of each counter off and on if you click the name of the counter in the legend area below the chart. Learn more about this, how to zoom, how to add this type of chart to reports, etc. in **[Interactive Graphs](/performanceguard/technical-reference/concepts/interactive-graphs/)**.
:::
:::note[Important]
Can I mix process name and process ID data?
Yes. For example, you can add a metric regarding the *svchost* process as such (by process name), and then you can add a metric regarding a specific instance of *svchost* (by process ID, for example *svchost - PS740*). This can be useful, because it lets you compare specific data (the specific *svchost* process ID) with more general data (*svchost* as such).
:::
# **Custom Counters**
The types of data that you can select on **Custom Counters** tab are the types of data collected by the custom counters that you have yourself set up in PerformanceGuard; see [Custom Counters](/performanceguard/administration/custom-counters/).
1. Start typing to search through all available computer names.

:::tip
If you prefer it, you can also search for agent IDs. Agent IDs are displayed to the right of computer names in search results.
:::
2. When you have selected a computer, select the counter (for example **IPv4**) that you want to know more about.
3. Select an instance (if not relevant, the field will simply show **\_**).
4. Select a value (for example **Datagrams/sec**).
5. Click the **ADD TO CHART** button. It may occasionally take a few seconds before the selected counter appears on the graph.
:::tip
If some of your counters overlap and are difficult to view, you can toggle the display of each counter off and on if you click the name of the counter in the legend area below the chart. Learn more about this, how to zoom, how to add this type of chart to reports, etc. in **[Interactive Graphs](/performanceguard/technical-reference/concepts/interactive-graphs/)**.
:::
:::note[Important]
I've selected the PhysicalDisk % Disk Time counter. Why is it sometimes higher than 100%?
The value may go over 100% if the selected computer is very busy, but this behavior is by design.
:::
:::note[Important]
Is performance good or bad?
That depends on the type of work that you do in your organization, but you can often follow our ****[I Want to Know if Performance Is Good or Bad](/performanceguard/i-want-to-know/i-want-to-know-if-performance-is-good-or-bad/)****.
:::