# Advanced TCP Activity Overview
> See advanced TCP activity counters from either the client or the server side of a connection.
Source: https://docs.capaone.com/performanceguard/technical-reference/concepts/advanced-tcp-activity-overview/
Product: PerformanceGuard — a separate CapaSystems product; do not apply this page to any other.
With the Advanced TCP Activity overview you can view the values of advanced TCP activity counters from either the client or server perspective *in a client-server relationship*.
To get the Advanced TCP Activity overview, select **ANALYZE > Overview > IP Traffic > Advanced TCP Activity** and then select if you want to view information about TCP *client* sockets (**Client TCP**) or TCP *server* sockets (**Server TCP**).
:::caution
Collection of advanced TCP/IP socket metrics is only supported on Windows operating systems from Windows Vista and onwards. This means that you can't view advanced TCP counters data from computers with earlier Windows versions.
:::
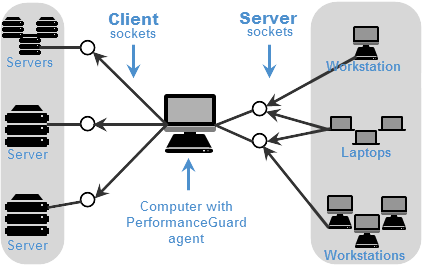
To fully understand the Advanced TCP Activity overview it's important that you're familiar with the client-server relationship. In the overview, a *server* isn't necessarily a computer with a server operating system. Instead, you should view *server* as the part in a client-server relationship that serves data requested by the *client* in that relationship.
Whether a computer can be seen as a client, a server, or both, in the overview is determined by the [Manage Agent Configuration Groups](/performanceguard/administration/manage-agent-configuration-groups/) that the computer belongs to: As part of the [Agent Configuration Group Settings](/performanceguard/administration/manage-agent-configuration-groups/agent-configuration-group-settings/) you can specify if the PerformanceGuard agent should automatically collect TCP *client* socket data reports, TCP *server* socket reports, or both. This means that if a computer with a regular client operating system has automatic collection of TCP *server* socket data enabled through the configuration of its PerformanceGuard agent, that computer can be seen as a *server* in the overview (provided it has been involved in TCP traffic).
When you use the overview, it can be helpful to imagine that the PerformanceGuard agent is the center of the world (click thumbnail to view image in full size):
# **Client TCP**
Select this option when you want to look at TCP *client* sockets.
1. In the **Interval** list, select the period of time that you want your overview to cover. If the predefined intervals don't suit you, select **Custom** to [Custom Time Periods on Graphs](/performanceguard/analyze/custom-time-periods-on-graphs/).
2. Select which **Port** you want your overview to cover. You can only select between [Port Lists](/performanceguard/administration/more-setup/port-lists/), that is ports that you have defined as being particularly interesting to keep an eye on.
3. In the **Agent** menu, select whether you want your overview to cover traffic from all client computers or from computers that belong to a particular [Grouping of Computers](/performanceguard/administration/manage-agent-configuration-groups/grouping-of-computers/).
4. In the **Server** menu, select whether you want your overview to cover traffic to all servers or to a particular server. You can only select between [Server Lists](/performanceguard/administration/more-setup/server-lists/), that is servers that you have defined as being particularly relevant to keep an eye on.
5. Click the **Update** button.
:::caution
Ports, computer groupings and servers are only selectable in the menus if there has been TCP traffic on them.
:::
# **Server TCP**
Select this option when you want to look at TCP *server* sockets.
1. In the **Interval** list, select the period of time that you want your overview to cover. If the predefined intervals don't suit you, select **Custom** to [Custom Time Periods on Graphs](/performanceguard/analyze/custom-time-periods-on-graphs/).
2. Select which **Port** you want your overview to cover.
3. In the **Agent** menu, select the server from which you want traffic to be covered by your overview. Keep in mind that in the overview's context, the term *server* means the part in a client-server relationship that serves data requested by the *client* in that relationship. Thus, in this context, the term *server* doesn't necessarily mean a computer that has a server operating system.
4. In the **Client** menu, select the client to which you want traffic to be covered by your overview.
5. Click the **Update** button.
:::caution
Ports, servers and clients are only selectable in the menus if there has been TCP traffic on them.
:::
# **Understand the Table of Results**
Your results are shown in a table with the following columns:
:::tip
If you are not familiar with TCP, you'll find it easier to interpret the results if you understand a fundamental principle: In TCP communication, the receiver sends an acknowledgment to the sender each time that the receiver has successfully received the sent data. The sender can use this fact to adjust how much data it should send to the receiver at any time in order to use the connection to the best possible extent.
:::
- **Server** or **Client** IP address (depending on which variant of the overview you have selected)
- **Protocol**.
- **Port**.
- **Samples**: The number of performance data samples available for the connection. The higher the number, the higher the validity of the data about the connection.
- **RTT Avg (ms)**: The average sampled round-trip time in milliseconds. Round-trip time (RTT) is the length of time it takes for a client to send a request plus the length of time it takes for an acknowledgment from the server to be received by the client. RTT does therefore not include the time it takes for server applications to respond or the time required for data transfer.
- **RTT Max (ms)**: The maximum sampled round-trip time in milliseconds. In short, this number tells you how bad things have been.
- **Current RTO (ms)**: The current retransmission timeout value in milliseconds. See *RTOs* in the following.
- **RTOs**: The number of retransmission timeouts. Retransmissions themselves are bad. Retransmission *timeouts* (RTOs) are really bad because they really slow down traffic: RTOs occur when senders get too few acknowledgments from receivers and therefore decide to break for a short moment before they attempt to send data again. Once the senders begin to send data again, they do it with a slow start, and this can lead to delays in traffic.
:::note[Important]
What's a slow start?
When a TCP connection is established, the sender carefully tests the capacity of the network by first sending only two packets of data. If that goes well, the sender sends four packets, and so on. The benefit of this is that TCP will ideally not send more data than the network and the receiver are able to handle. The downside is that it takes a while before a TCP connection is working at its full capacity. If slow starts only happen when connections are established, they are generally not a problem. However, if connections often time out and have to be re-established, slow starts can be a great problem because it takes time for the connection to get up to speed again each time it's re-established.
:::
- **Spurious RTOs**: The number of acknowledgments about data that has already been sent again due to a retransmission timeout (RTO). A spurious retransmission is basically data that was sent again even though the receiver has already acknowledged receipt of it. The number thus tells you about data that has needlessly traveled on the network twice.
- **Fast Retran.:** The number of invocations of the Fast Retransmit algorithm. A high number of fast retransmissions can indicate a performance issue with a high number of lost frames.
- **Bytes Retran.**: The number of bytes retransmitted. This number tells you how much data that has been sent again because the original sending failed. The number thus tells you about the amount of data that has traveled on the network twice.
- **DupAcksIn**: The number of duplicate acknowledgments. This number indicates receptions where data packets were missing or re-ordered.
- **selective acks rcvd**: The number of selective acknowledgments (SACKs—that's where the receiver explicitly lists which packets, messages, or segments in a stream are acknowledged, either negatively or positively). Again, this number indicates receptions where packets were missing or re-ordered.
- **congestion count**: The number of times that the size of congestion window has been decreased because the sender detected signs of congestion on the connection. Such signs can be, for example, fast retransmits or timeouts. If the congestion count is high, it tells you that it has often been necessary to decrease the size of the congestion window, which in turn is a sign of a limited ability to successfully send data over the connection.
:::note[Important]
What's a congestion window?
It's a congestion control mechanism that determines the number of outstanding bytes that's allowed on the connection. It's thus a way of preventing the connection from being overloaded. The size of the congestion window is adjusted up/down by the sender based on the amount of data that the sender is able to send and get acknowledged by the receiver. If sent data is successfully received and acknowledged by the receiver, the congestion window will grow exponentially until a timeout occurs, after which the window is reset. When a timeout occurs, and the congestion window is reset, a slow start (see the previous) takes place. It's best if the congestion window is reset as few times a possible.
:::
:::caution
Note that retransmission timeouts (RTOs) reduce the size of the congestion window because RTOs determine how often slow starts are required (see *What's a slow start?* in the previous).
:::
- **pre cong sum count**: The sum of the values of the congestion window, in bytes, captured each time that the sender detects a sign of congestion.
:::tip
Use the search feature in the top right corner of the table of results to narrow your search results. You can search for text, such as protocol names, as well as numbers.
:::
:::tip
[**Microsoft Windows Dev Center**](http://msdn.microsoft.com/en-us/library/windows/desktop/ee720198(v=vs.85).aspx) has detailed technical descriptions of the TCP activity counters.
:::
# **View Results in a Graph**
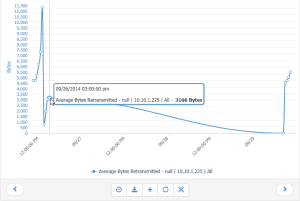
Some of the values in the table of results are clickable. If you click one of the links, you can view the selected data in the interactive [TCP Counters](/performanceguard/technical-reference/concepts/tcp-counters/). Example:
# **Export Overview**
Once you have generated an overview, you can export it in two formats:
- **Excel Export**: Export to Microsoft Excel .xls format
- **OOXML Export**: Export to [**Office Open XML**](http://officeopenxml.com/), a zipped XML-based format