# Multicast Traffic
> What multicast traffic is, and what PerformanceGuard reports about it.
Source: https://docs.capaone.com/performanceguard/i-want-to-know/i-want-to-know-who-generates-ip-traffic/multicast-traffic/
Product: PerformanceGuard — a separate CapaSystems product; do not apply this page to any other.
Multicast is when someone sends a single set of data packets across a network to multiple selected users at the same time. Multicast is subscription-based: Computers that want to receive multicast traffic use ICMP messages to let routers know which multicast addresses they want to subscribe to. The routers are then able to calculate which multicast messages they need to send to receivers on their different interfaces. A packet is considered a multicast packet if the destination IP address is in the range 224.0.0.0 to 239.255.255.255.
The Multicast time view graph (**ANALYZE > Graphs > Time View > Multicast Traffic**) lets you view the number of sent and received UDP packets and bytes on multicast IP addresses.
You can view such numbers measured on either the sender or on the receivers of the multicast traffic.
:::caution
When you view data about multicast traffic, be aware of the fact that senders will *not* know who receives the outgoing multicast traffic. This is because they send data to a general multicast IP address rather than to specific IP addresses of receivers and because the UDP protocol doesn't support acknowledgment of received data. Receivers, on the other hand, will know who sent the incoming multicast traffic.
:::
:::tip
**This graph is useful because ...** it lets you view the amount of multicast traffic on all or individual parts of your network over time. When viewed in isolation this may provide limited value, but if—for example—you know that a particular part of your network suffers from long response times, you can use this graph to quickly verify if large amounts of multicast traffic on that part of the network may contribute to the long response times.
:::
# **View Multicast Traffic Measured on Sender**
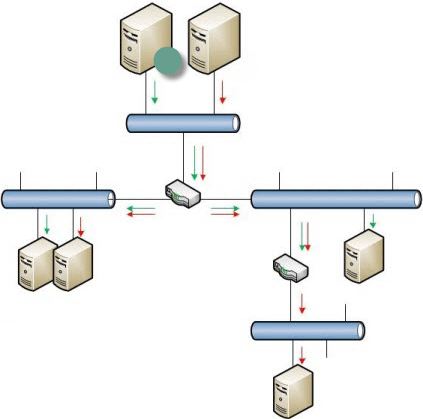
Use this view if you want to know about multicast traffic measured on a computer that sends multicast traffic.
In the example illustration (click thumbnail to view image in full size) sent multicast traffic is measured on the computer with the green dot:
1. Make sure that **Measured on Sender** is selected.
2. Select required multicast sender. You can only select a single sender per graph.
3. If you want to limit your results to a particular type of multicast traffic, select required multicast group. Otherwise select **All Multicast**.
:::note[Important]
What's a multicast group?
Multicast groups help you filter your data if you are only interested in a particular type of multicast traffic. PerformanceGuard comes with preconfigured groups for common types of multicast traffic, LLMNR and SSDP, and PerformanceGuard administrators can set up additional groups. See also **[Manage Multicast Groups](/performanceguard/administration/more-setup/manage-multicast-groups/)**.
:::
4. In the **Type** menu, select what you want to view on the graph: Number of sent packets per minute or second, or number of sent bytes per minute or second.
5. In the **Interval** menu, select the period of time that the graph should cover. If the predefined intervals don't suit you, select **Custom** to [Custom Time Periods on Graphs](/performanceguard/analyze/custom-time-periods-on-graphs/).
6. Click the **Update** button.
# **View Multicast Traffic Measured on Receivers**
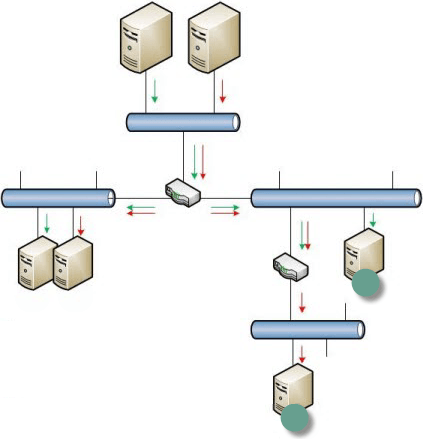
Use this view if you want to know about multicast traffic measured on selected computers that receive multicast traffic.
In the example illustration (click thumbnail to view image in full size) received multicast traffic is measured on the computers with the green dots:
1. Select **Measured on Receiver**.
2. Select required multicast receivers. The receivers are grouped into locations and/or groups based on which network they belong to. If you want to know about multicast traffic received on any computer, select **All agents**.
3. If required, you can use the **Multicast Servers** menu to limit your results by selecting a specific multicast server from which the received traffic must have been sent. The server that sent the multicast traffic doesn't have to be a server on your own network, it can also be an external one. If you want to know about multicast traffic received from any server, select **All servers**.
:::note[Important]
I can't select the multicast server that I want. What's wrong?
Only monitored multicast servers are listed. See **[Server Lists](/performanceguard/administration/more-setup/server-lists/)** for details about monitored servers.
:::
4. If you want to limit your results to a particular type of multicast traffic, select required multicast group. Otherwise select **All Multicast**.
:::note[Important]
What's a multicast group?
Multicast groups help you filter your multicast data if you are only interested in a particular type of multicast traffic. PerformanceGuard comes with preconfigured groups for common types of multicast traffic, LLMNR and SSDP, and your PerformanceGuard administrator may have set up additional groups. See also **[Manage Multicast Groups](/performanceguard/administration/more-setup/manage-multicast-groups/)**.
:::
5. In the **Type** menu, select what you want to view on the graph: The number of received packets per minute or second, or the number of received bytes per minute or second.
6. In the **Interval** menu, select the period of time that the graph should cover. If the predefined intervals don't suit you, select **Custom** to [Custom Time Periods on Graphs](/performanceguard/analyze/custom-time-periods-on-graphs/).
7. Click the **Update** button.
:::note[Important]
Why can't I view response times for multicast traffic?
Multicast messages are unacknowledged (that is receivers don't confirm that they have received the messages). Therefore, you can't be sure of exactly when the messages were received, and therefore PerformanceGuard doesn't monitor multicast response times or multicast network transmission times.
:::
:::tip
You can also view multicast activity in a table format by selecting **ANALYZE > Overview > IP Traffic > Multicast Activity**. See [Multicast Activity Overview](/performanceguard/i-want-to-know/i-want-to-know-who-generates-ip-traffic/multicast-activity-overview/).
:::