# Application View
> See the availability and response times of applications that representative agents contact at regular intervals.
Source: https://docs.capaone.com/performanceguard/i-want-to-know/i-want-to-know-if-applications-work-ok/application-view/
Product: PerformanceGuard — a separate CapaSystems product; do not apply this page to any other.
The application view graph (**ANALYZE > Graphs > Time View > Application View**) shows the availability and response times of applications that are automatically contacted by representative PerformanceGuard agents at regular intervals. This requires that your organization has set up application pings. See **[Monitor Availability, Latency and Response Times with Application Ping](..\..\Administration\Manage%20Agent%20Configuration%20Groups\Agent%20Configuration%20Group%20Settings\Monitor%20Availability,%20Latency%20and%20Response%20Times%20with%20Application%20Ping.md)** for details about how to create and activate an application ping.
:::tip
**This graph is useful because ...** it lets you verify application availability and response times over time, as experienced by all or individual parts of your organization.
:::
- **Application Ping**: Select required application ping. Application pings may be based on ICMP pings, HTTP requests or traceroutes. The type of application ping is listed in brackets after the application ping name.
- **Agents**: Select the group of computers that the graph should be based on.
- **Interval**: Select the period of time that the graph should cover. If the predefined intervals don't suit you, select **Custom** to [Custom Time Periods on Graphs](/performanceguard/analyze/custom-time-periods-on-graphs/).
- **Availability Detail**: Controls how often availability should be calculated for the graph.
- **Y-axis Min and Max**: Specify the range that you require for the graph's vertical axis. If you leave the fields empty, the range will automatically reflect the minimum and maximum values found in the data.
- **Disconnect samples**: The samples in the graph will by default be **Automatic**. If you don't want this you can select **Connect All**  or set them to **Disconnect All**  .

Connected samples

Disconnected samples
Response time is plotted as a red line, availability is drawn in green.
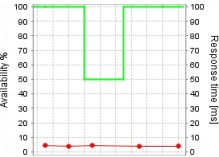
If no data is available for a time period, the availability line isn't broken. Instead the missing time period gets the same value as the previous period.
:::caution
When you view the graph, you'll also see a **Statistics** table below the graph. Note that the **Statistics** table shows the weighted average for the graph's samples. That means that each value to be averaged is assigned a weight based on the number of occurrences of that value.
:::
:::note[Important]
When is something considered to be available?
To answer this we need to look at response times: If response times are so long that use of a service, website, transaction or similar becomes impossible, PerformanceGuard considers the service, etc. to be *un*available. By default, PerformanceGuard loses its patience with a service, etc. if it hasn't responded within 500,000 milliseconds (that's a little more than eight minutes). Everything that's not *un*available, is considered by PerformanceGuard to be available. So, if you see that a service has been 100% available during the last week, it means that it has not exceeded the acceptable response time limit during the last week.
Do you measure availability of application pings (HTTP requests, ICMP ping and/or traceroutes)?
For **[Monitor Availability, Latency and Response Times with Application Ping](..\..\Administration\Manage%20Agent%20Configuration%20Groups\Agent%20Configuration%20Group%20Settings\Monitor%20Availability,%20Latency%20and%20Response%20Times%20with%20Application%20Ping.md)**, PerformanceGuard looks not only at acceptable response times, but also at whether a response is expected or not: If the response is unexpected, for example if the response has a response code of *404 Not Found*, PerformanceGuard considers the service to be *un*available, even if the response was received within acceptable time.
:::
:::note[Important]
Is performance good or bad?
That depends on the type of work that you do in your organization, but you can often follow our [I Want to Know if Performance Is Good or Bad](/performanceguard/i-want-to-know/i-want-to-know-if-performance-is-good-or-bad/).
:::