# Manage Custom Reports
> Create, copy, edit, schedule, and e-mail custom PerformanceGuard reports for stakeholders across your organization.
Source: https://docs.capaone.com/performanceguard/administration/manage-custom-reports/
Product: PerformanceGuard — a separate CapaSystems product; do not apply this page to any other.
:::caution
You can only do this if you're a PerformanceGuard administrator.
:::
With PerformanceGuard you can create, copy, edit and delete reports. There is no limit on the number of reports you can have on your PerformanceGuard solution.
A report can be generated on the fly when you view it online, or it can be generated automatically every day, week or month, and archived for later viewing.
It's also possible to automatically generate and send reports to selected people via e-mail.
## **Create New Report or Edit Existing Report**
1. In the PerformanceGuard web interface, select **ADMINISTRATION > Reporting > Reports**.
2. If you want to create a new report, click the **Create New Report** button. If you want to edit an existing report, click the Edit icon  next to the required report.
3. Specify settings for your report:
- **Name**: (Mandatory) Type the title that shall appear on the front page of your report. The report title can be up to 255 characters long, including spaces, but we highly recommend that you use a much shorter title.
- **Description**: (Optional) Up to 30 lines of text that'll appear at the beginning of the report, before any data.
- **End text**: (Optional) Unlimited amount of text that'll appear at the end of the report.
- **Short Name**: (Mandatory) Specify a short name that'll be used in the report's file name. A short name is automatically suggested, but we recommend that you change the short name to a name that's meaningful in your organization. You can include underscores \_ in a short name, but don't include spaces or special characters like æ, /, { or $. The short name must be unique; you can't use the same short name for two different reports.
- **Business Unit Group**: Select which business groups shall have access to the report.
- **Interval**: Select the time interval that the report should cover. All intervals are relative to the time that the report will be generated.
:::note[Important]
**Example:** If you select **0-4 hours**, the report will cover the last four hours leading up to the time that the report is generated.
:::
If you select **None selected**, the report will by default use the intervals specified for the individual report items themselves (that is if a graph uses the interval 0-12 hours, that interval will be used for that graph in the report).
:::note[Important]
How do I know which interval an individual item uses?
If you edit an existing report, click the **View graph/table** icon next to the required item in the **Report Items** list in the right part of the page. If you create a new report, you can determine the interval later when you generate graphs or tables and add them to the report.
:::
**Agent Super Group**: Select the super groups that shall by default be used when PerformanceGuard selects data for the report's items (that is graphs, tables, etc.). If you select **None selected**, the report will by default use the values specified in the individual report items themselves (that is if a graph uses data from a server at your London office, that data is what will be shown in the report).
:::note[Important]
How do I know which value an individual item uses?
If you edit an existing report, click the **View graph/table** icon next to the required item in the **Report Items** list in the right part of the page. If you create a new report, you can determine the agent super group later when you generate graphs or tables and add them to the report.
:::
:::caution
If you want to be able to automatically send the report to different subscribers with data based on individual subscribers' locations (see *Automatically Send Report to Subscribers via E-Mail* in the following), you must select an agent super group.
:::
4. You can always generate your reports manually in the PerformanceGuard web interface ( **REPORTING > Reports**), but with the following options you can set up a report to be generated automatically:
:::note[Important]
Where are automatically generated reports stored?
By default, they are stored in `[PerformanceGuard installation folder\]\reports\`. You can change this in the PerformanceGuard web interface: **Select ADMINISTRATION > Setup > Parameters**, then select the **Display** tab, and then specify a different path in the **Report Directory** field.
:::
- **Frequency**: Select how often the report shall be automatically generated.
- **Delete after**: In order not to waste disk space on storing old and unwanted reports, automatically generated versions of your report can automatically be deleted after a period of time. Default is 90 days. To keep generated versions of the report indefinitely, specify *0* (zero).
- **Formats**: Automated reports are always generated in PDF format. You can specify whether the report should also be generated in HTML format.
- **Run Options**: If you selected a specific location or super group in the *Agent Super Group* menu, you are able to select if the report should be run for each sub-location of the selected location/super group (if any sub-locations exist). If you don't select this, the report will only be run for the location/super group that you selected in the in the **Agent Super Group** menu.
:::caution
If you want to be able to automatically send the report to different subscribers with data based on individual subscribers' locations (see *Automatically Send Report to Subscribers via E-Mail* in the following), you must select the **Run on each sub-location of the selected agent super group** option.
:::
:::tip
If you edit an existing report, you can copy and edit the report's items, or change the sequence in which they are shown, in the **Report Items** list in the right side of the page.
:::
5. When ready, click the **Create** button (if you create a new report) or the **Update** button (if you edit an existing report).
:::caution
If you created a new report, your report doesn't yet contain any data. See *Add Data to Report* in the following for information about how to add graphs and other data to your report.
:::
## **Copy Existing Report**
If you want to base a new report on an existing report, you can simply copy the required report and edit it:
1. In the list of custom reports (**ADMINISTRATION > Reporting > Reports**), click the Copy icon  next to the report that you want to copy. The copied report will now appear in the table with the label *(copy)* added to its name.
2. Click the Edit icon  next to the copied report, and edit the report's settings as required.
3. Click the **Update** button.
## **Add Data to Report**
The following describes how to add a graph to a report. You can use the same method for adding other content, such as top 10 lists, tables or pie charts; more information about this is available at the end of this description.
When you generate a graph in the PerformanceGuard web interface (**ANALYZE > Graphs > …**), you'll see an **Add to custom report** link below the graph (click thumbnail to view image in full size).
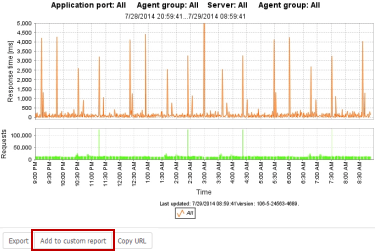
1. Click the **Add to custom report** link.
2. Specify the following:
- **Report**: Select the report to which you want to add the graph.
:::note[Important]
Can I include the graph in multiple reports?
You can only select one report at a time. If you want to include the graph in more than one report, simply generate the graph again and then repeat this process after completing step 4.
:::
- **Header**: (Mandatory) Type the headline that shall be used for presenting the graph in the report. The header will also be used in the report's table of contents. The header can be up to 255 characters long, including spaces.
- **Description**: (Optional) A description that'll appear below the graph in the report. The description can be up to 255 characters long, including spaces.
3. Click the **Add to report** button.
4. You are taken to the **Report management** tab, where you can view details about the report in which you included the graph. In the tab's **Report Items** section, you can see which graphs are included in the report.
:::tip
If your report contains more than one graph, you can change the sequence in which the graphs are shown in the report. Use the Move Up  and Move Down  buttons next to the graph listings in the *Report Items* section.
:::
:::caution
For performance reasons a report meant for online generation should not contain a large number of different graphs.
:::
You can use this method to include other content than graphs in a report. For example, you can also include hotspots (such as top 10 lists of login times) or IP traffic load overview pie charts, because they also have **Add to custom report** links. You find hotspots and other overviews by selecting **ANALYZE > Overview**.
Furthermore, you can quickly include PerformanceGuard's [Performance Counters](/performanceguard/technical-reference/concepts/performance-counters/) in reports if you click an icon below such charts.
## **Automatically Send Report to People via E-Mail**
If you have set up a report to be generated automatically (see *Create New Report* in the previous), the report can automatically be sent via e-mail to selected recipients:
1. In the PerformanceGuard web interface, select **ADMINISTRATION > Event Management > Notification Recipients**.
2. If the recipient hasn't been defined yet, click the **New Notification Recipient** button and specify details about the new recipient. Leave the **Email summary reports** field as it is. When ready, click **Save**.
3. In the **Notification Recipients** list, click the Edit icon  next to the required recipient.
4. Select the **Report Subscriptions** tab.
5. Select the required **Report** and **Location**.
Your location selection defines which of your organization's locations that'll be covered by the report for the recipient in question.
:::tip
This gives you the flexibility of being able to automatically deliver the same report to different recipients with data from different locations.
:::
:::note[Important]
**Example:** The manager of your London office wants the Citrix Daily report about his location, whereas the manager of your Manchester office is interested in the same report, but with data from the Manchester location.
:::
:::caution
You are only able to select between reports that are automatically generated by PerformanceGuard.
:::
:::caution
You are only able to select location if the following prerequisites are met: [**Locations**](#) must have been set up. Also, in the report's settings (see *Create New Report or Edit Existing Report* in the previous) an agent super group as well as the run option **Run on each sub-location of the selected agent super group** must be selected.
:::
6. When ready, click the **Add Subscription** button.